Luminance Analyzer
See Your Image the Way the Masters Did
Beauty may be subjective, but some principles of light and tone are not. When an experienced eye tells you an image feels too dark, too flat, or too harsh, it may seem at first that it is just a personal opinion – a feeling – that can be dismissed. But there’s often something universal behind that judgment – something quantifiable and measurable. A hidden geometrical pattern waiting to be uncovered.
What if we reveal this pattern and you could quantify it yourself? And then justify a feeling with the ‘hard’ data?
The Idea
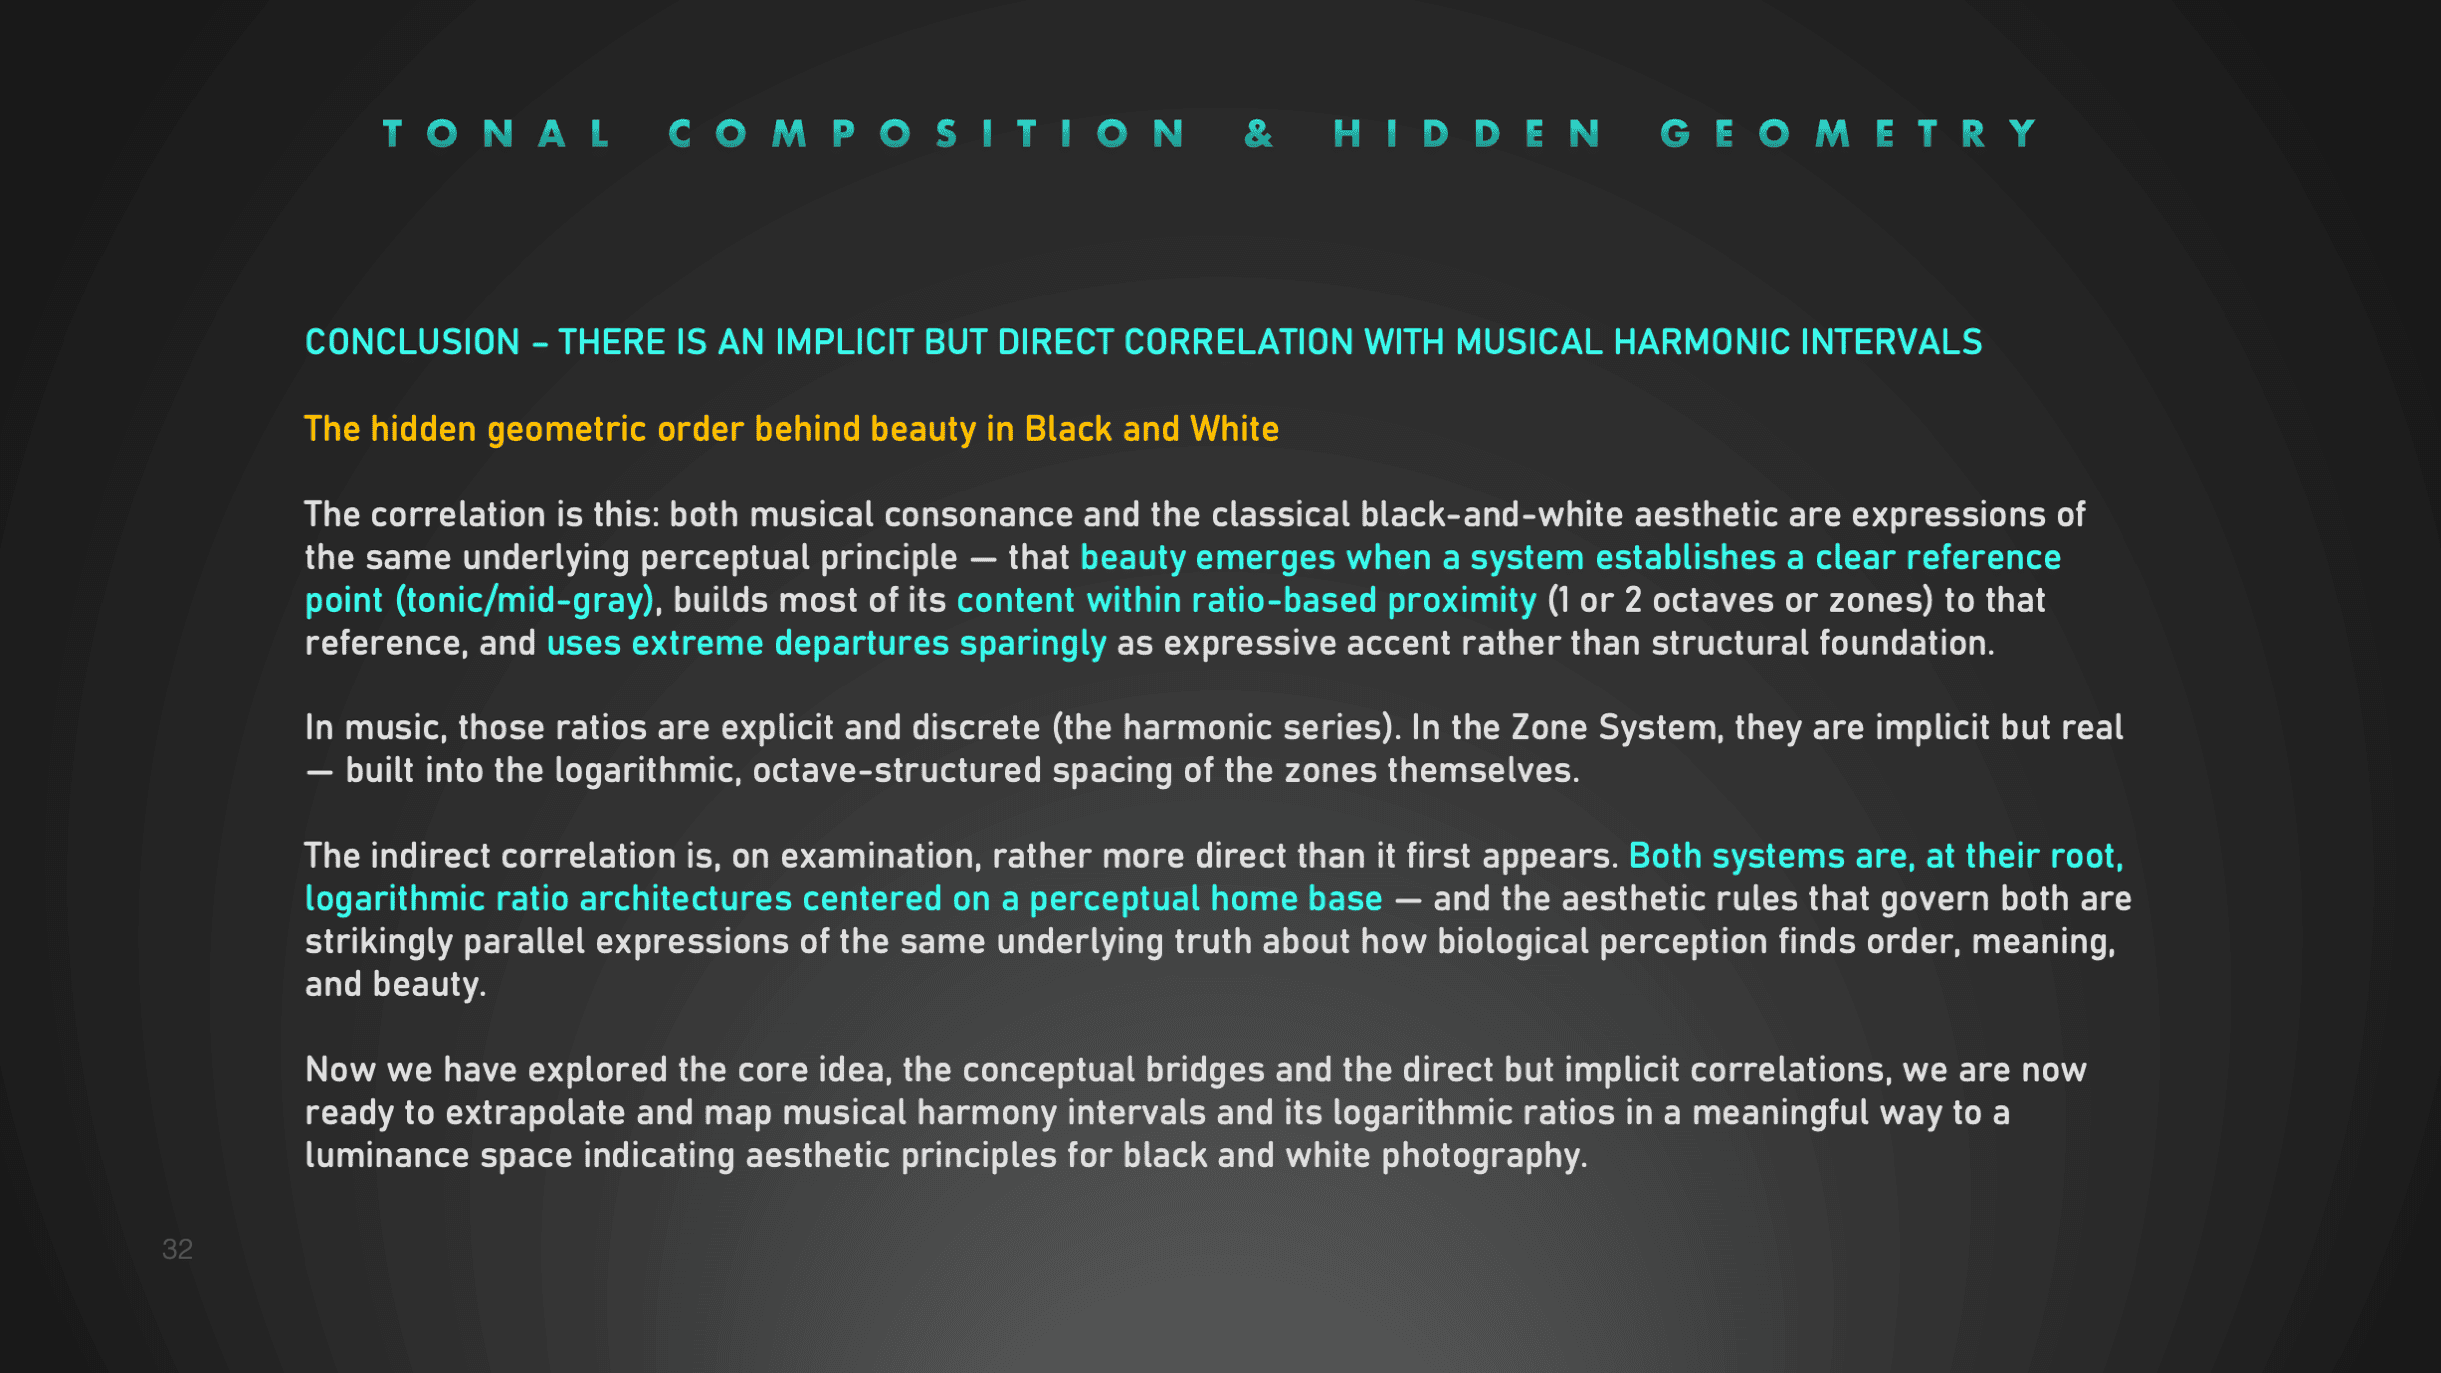
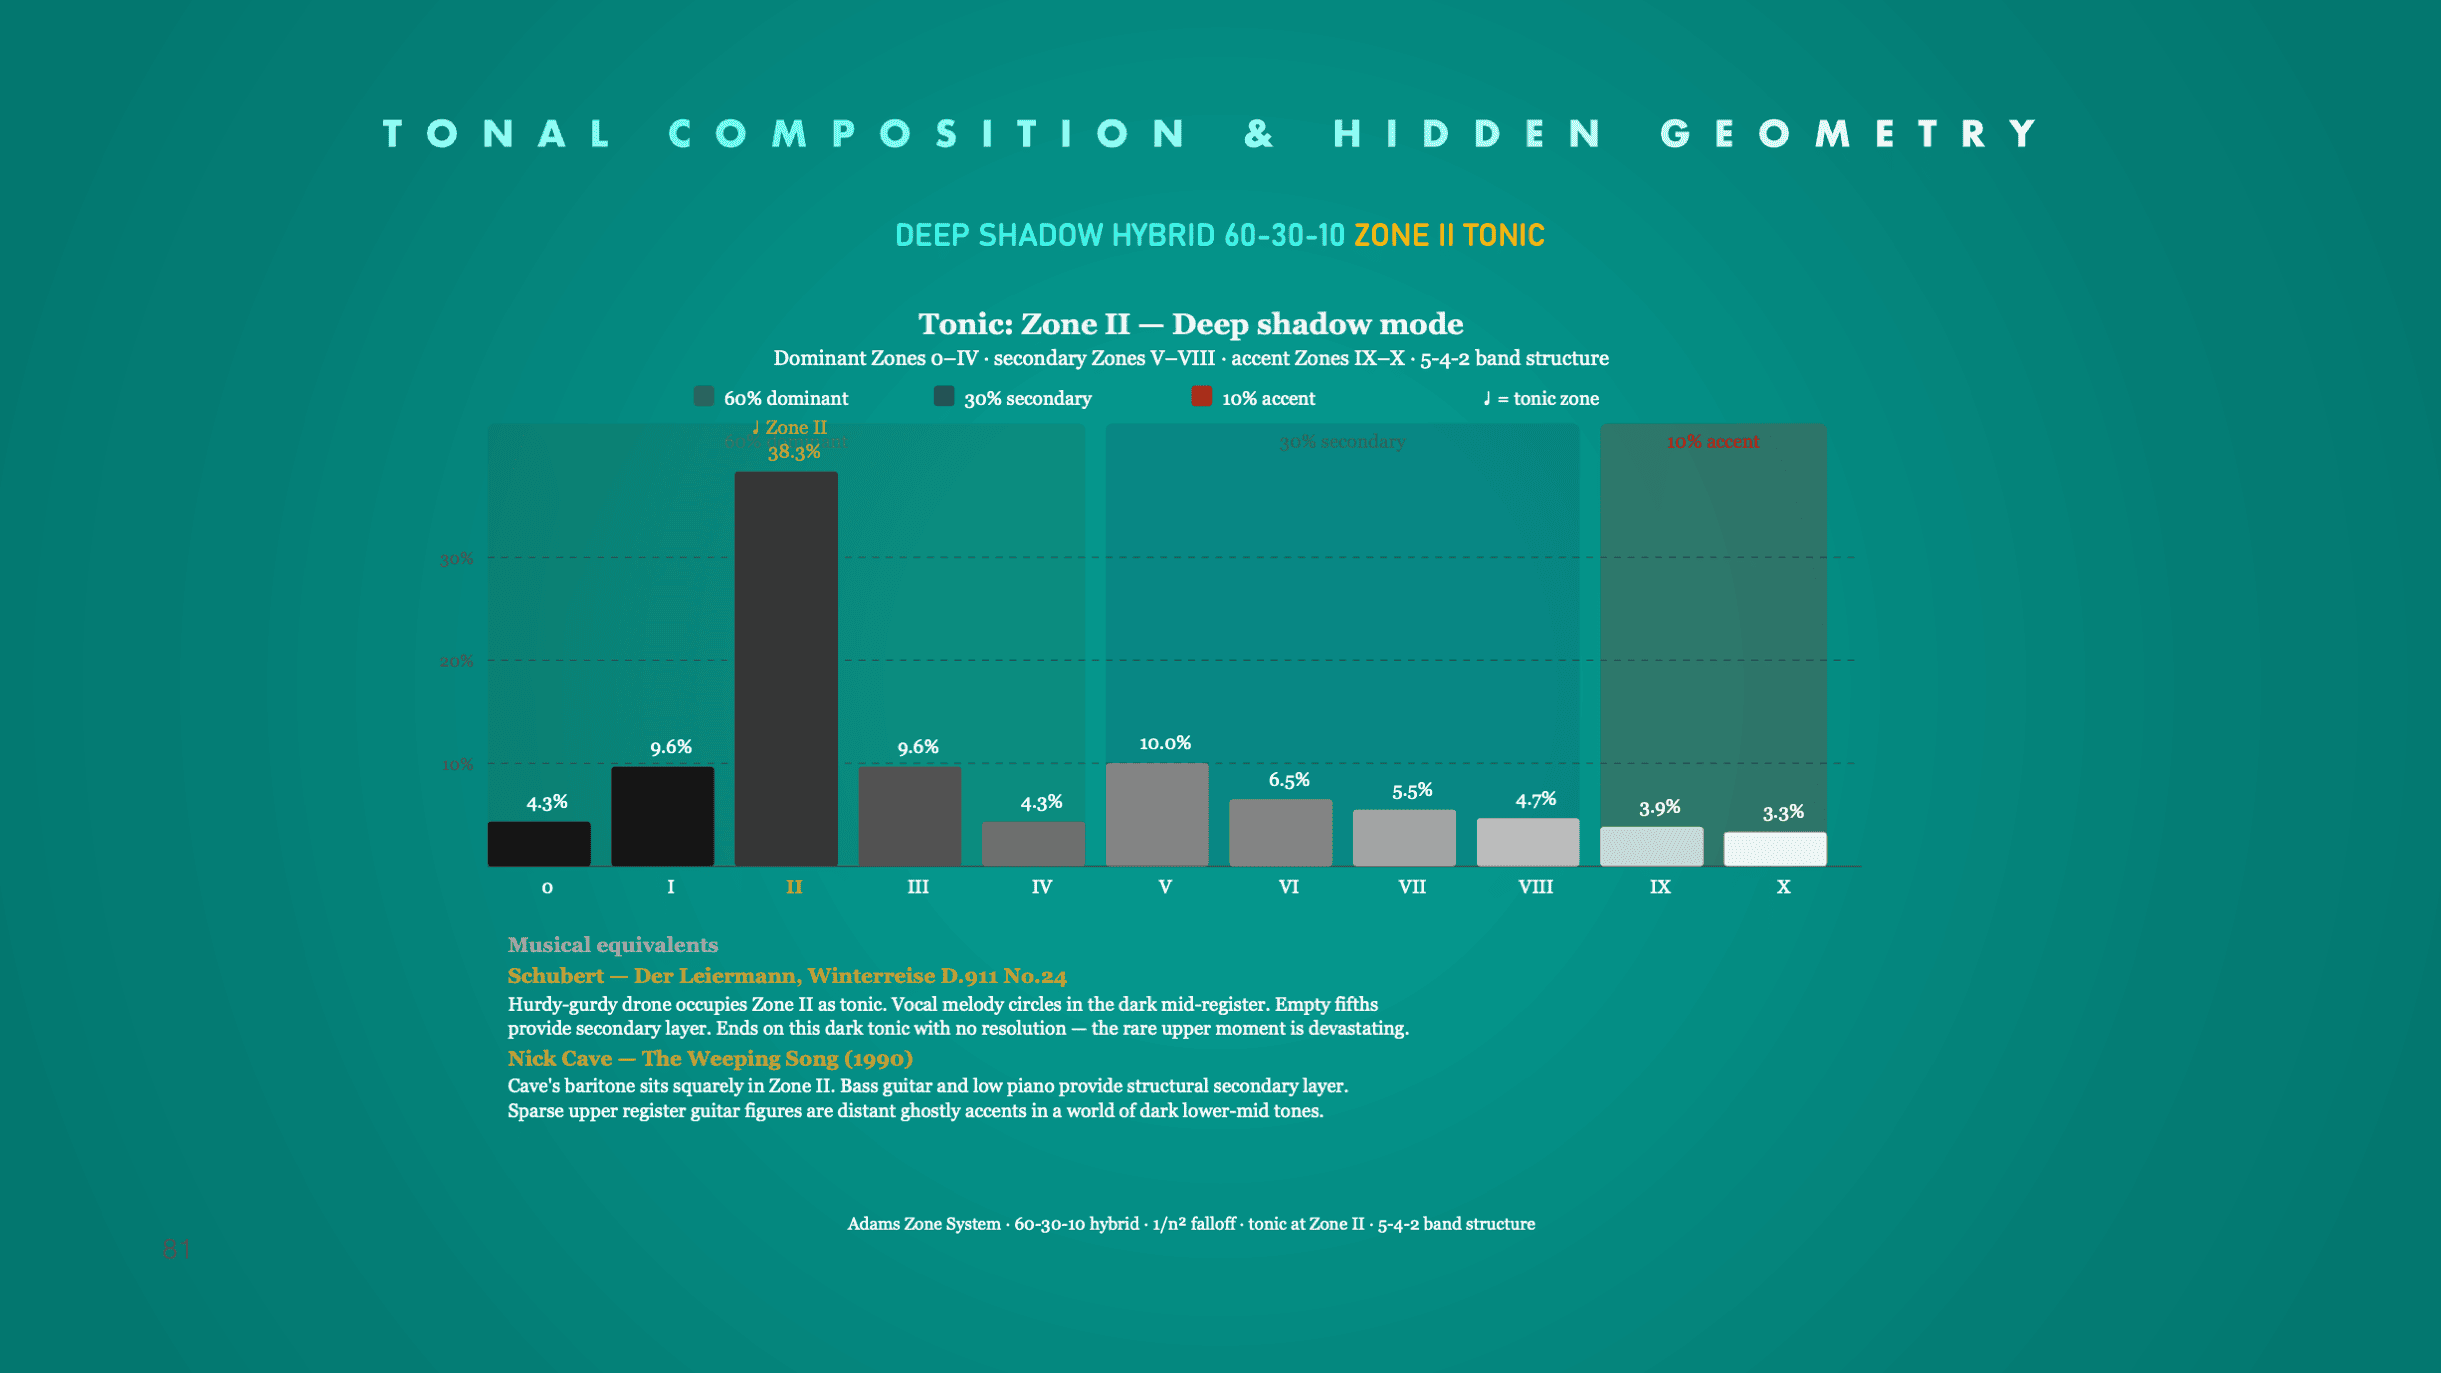
Harmonic intervals in music and the 60-30-10 rule in design share a common mathematical foundation. I mapped both onto Ansel Adams’ Zone System to create two precise reference models for tonal distribution:
The Harmonic Intervals Model
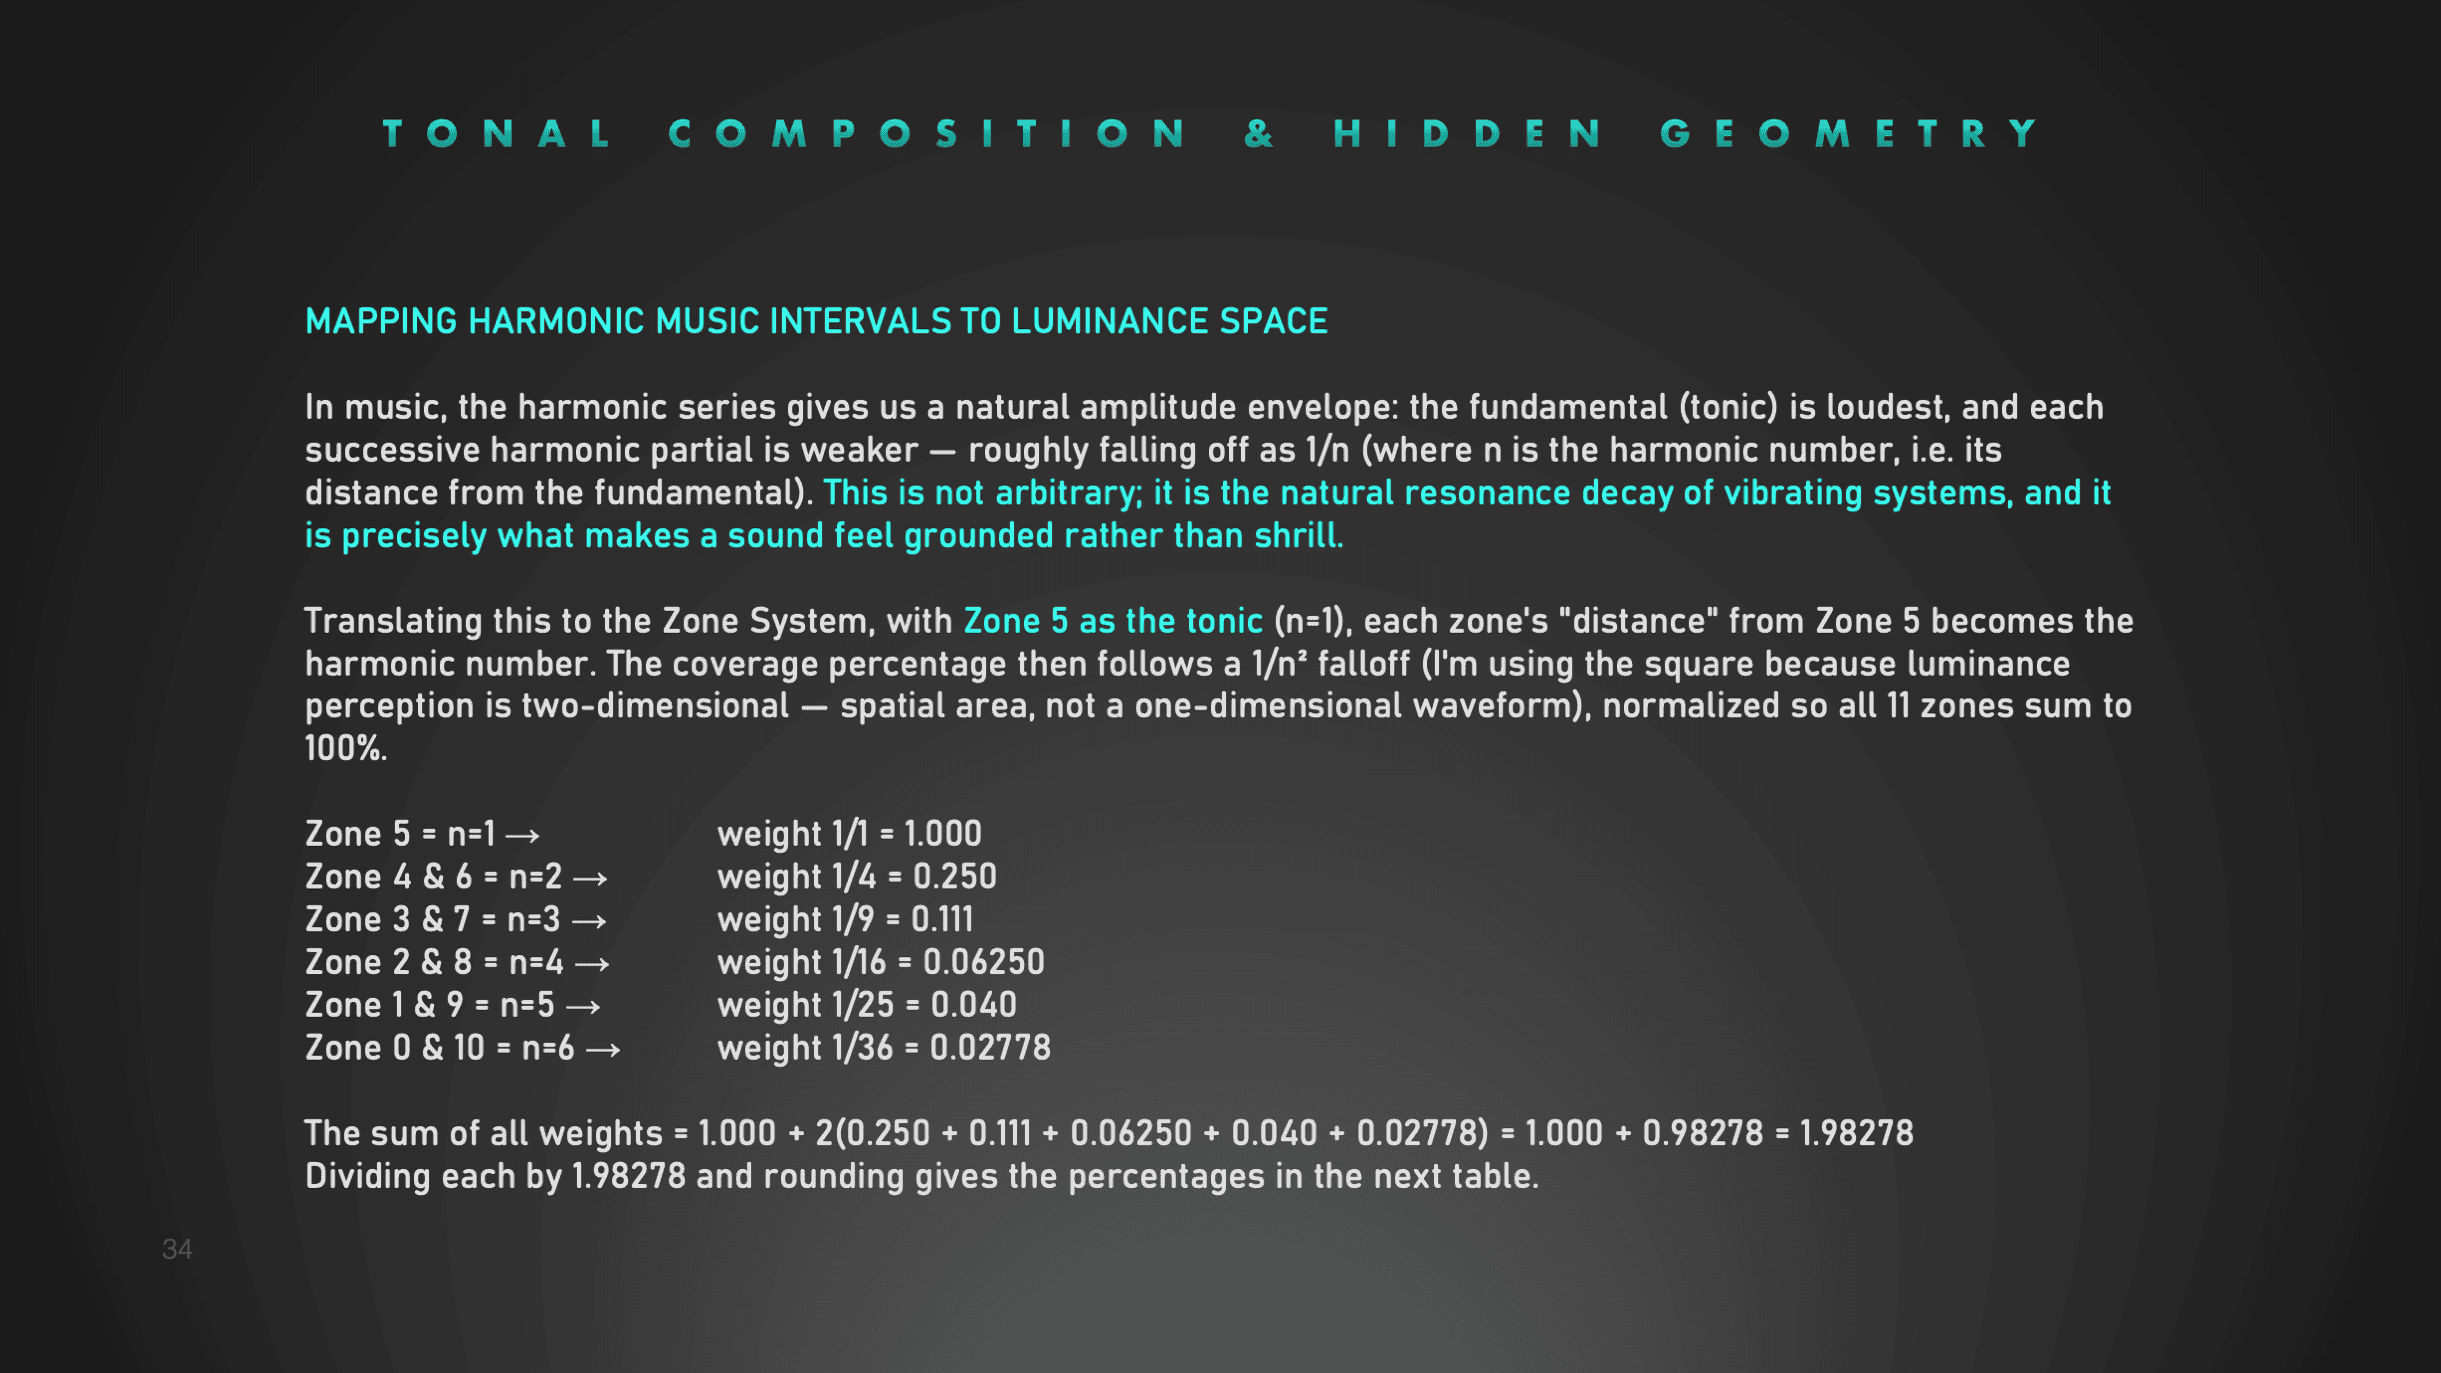
Based on the natural falloff of overtones in music, translated into ideal zone coverage
The Hybrid 60-30-10 Model
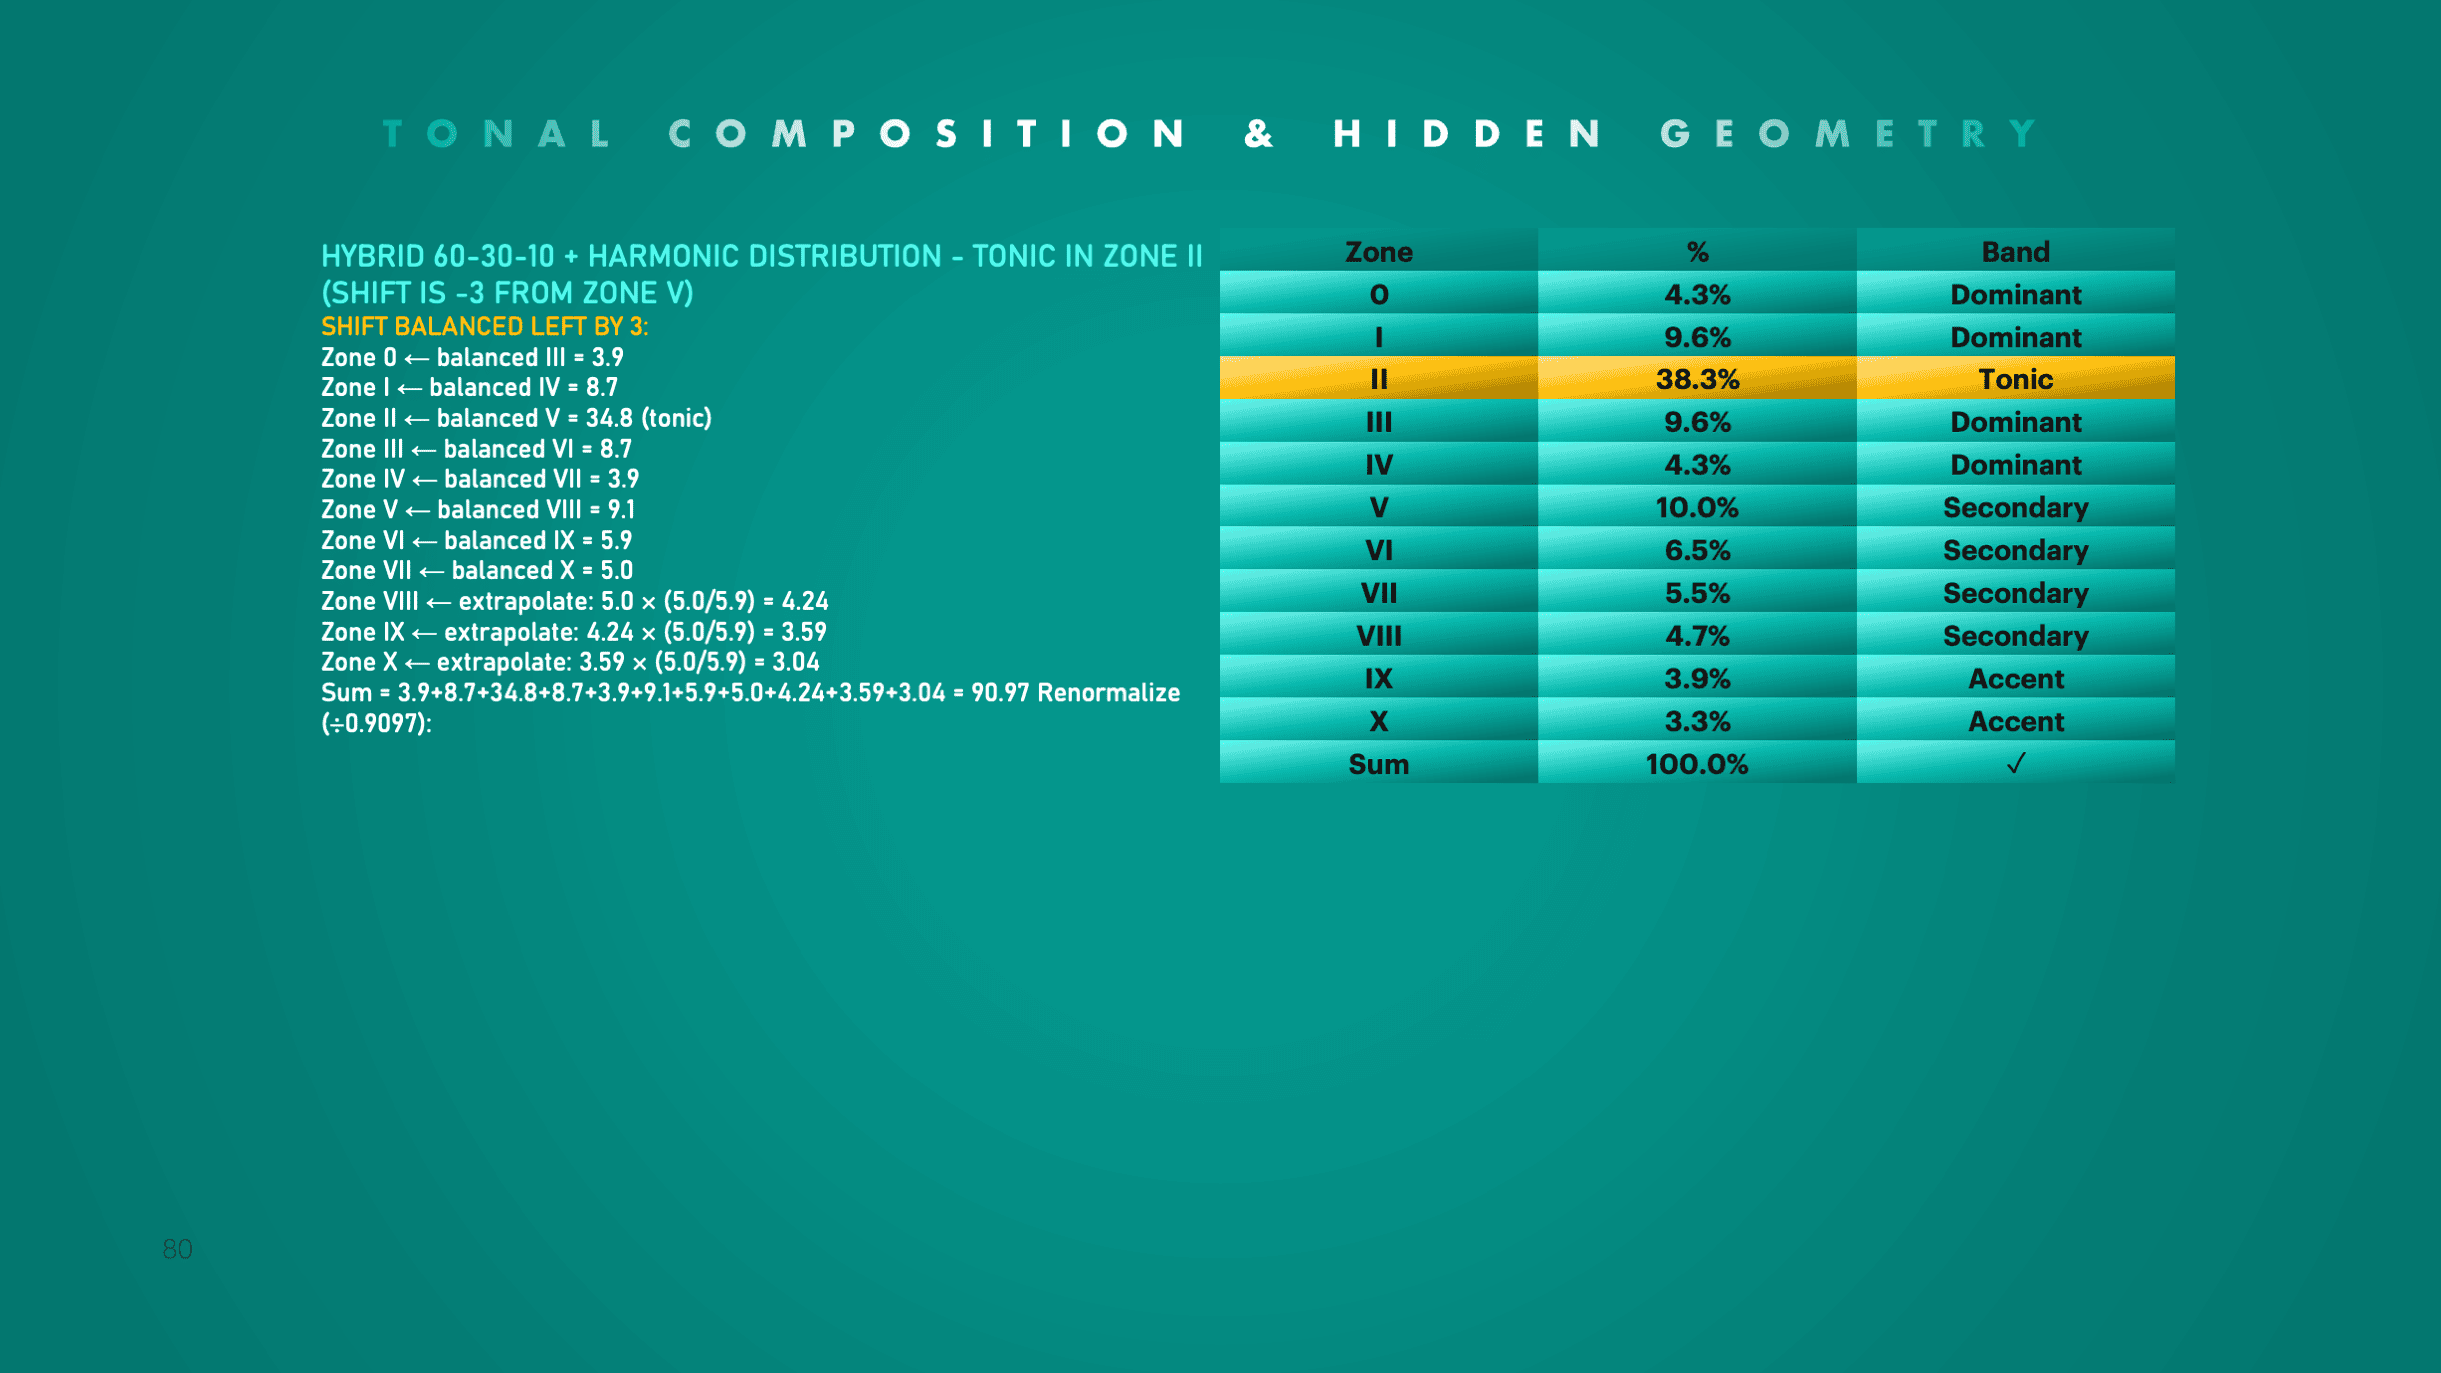
This model combines the three-band structure of design's 60-30-10 rule with harmonic internal distribution, available for every tonic from Zone I through Zone IX
Together they give you an exact, principled reference – not someone’s opinion, but universal proportions your eye already recognizes as beautiful.
The Plugin
An accurate and objective extra pair of eyes for critical feedback
Luminance Analyzer brings these two universal models into Photoshop as a practical analytical tool. Measure your image against the reference distributions (visualized in charts and tables that are accessible via the plugin buttons), check the image’s tonal distribution and the contrast zone by zone, and draw your own conclusions.

Quick Access Guide & Charts
Quick Reference Guide + Charts & Tables are accessible via the plugin buttons (bottom row)
Measures exact tonal distribution
Analyzes exact tonal coverage in percentages per zone according to the Zone System
Quick Indications
Detects clipping in pure shadows and highlights.
Charts & Tables with Ideal Tonal distributions
Compares your image against ideal harmonic tonal distributions accurately mapped from harmonic intervals, within the 60-30-10 design structure
Measuring contrasts accurately
Measures contrast expressed as zone differences accurately
Contrast color overlay for instant detection
Color overlay to instantly visualize contrast distribution across the image
Selective contrast analysis
Selective contrast analysis for specific areas
Check-Adjust-Check
Adjust if needed with the photo editing software you prefer, to match the reference data as close as possible
One-off purchase
Available as a one-off purchase at the Adobe Store only
The plugin measures the tonal distribution and contrasts (measured in exact zone differences) and presents the numbers in dialog boxes. What to do with these exact numbers?
- You hold these numbers against the reference tables and charts that are accessible via the plugin.
- You choose the dominant zone (the tonic) you want your image to be in to reflect your mood and intentions.
- If the numbers are close to the ideal numbers in charts and tables, you are done and know lights and shadow are harmonically distributed throughout the image.
- If the resulting numbers from the plugin deviate too much from the reference charts for your desired tonic, you know your image is ‘too dark, too light, too harsh’ and you can adjust in your preferred photo editing software and measure again.
- You can do the same with measuring contrasts, measured in zone differences.

An example of a reference chart, reference table, and luminance wheel with the exact percentages for ideal coverage according to the hybrid 60-30-10 model with a tonic in zone VI
How To Use
The plugin is just the analytical tool to create more ‘harmonic images’ based on your preferred tonality: low-key, classic, high-key, very dark and moody, etc. The importance is in using the reference charts to create more harmonious images. Not just too dark, too light, too flat, etc. The plugin enables that by objective and accurate measurement. A suggested way of using (there are more – see the Quick Ref guide):
- Visualize and articulate your style for yourself
- Process the image in that style using your preferred editing software
- After you created a good draft, analyze the image with Luminance Analyzer > zone system analysis
- It returns a dialog box with the exact percentage for each zone. And it will indicate your tonic (dominant zone)
- Look up the chart and table with that tonic – I suggest the Hybrid 60-30-10 model
- See how close your tonic is to the ideal percentage and adjust if needed
- Important: with that given tonic, the other zones need to be distributed according to the chart to ensure harmonic distribution of tones
- Close is good enough, matching the percentages exactly is not the purpose
- Recalibrate and adjust with editing software
- Measure again
Zone Analysis

The Zone Analysis results of the Zeeland bridge photo. The results show that the tonic is in Zone V (highlighted) and the indication at the bottom says: Mid tone rich, well balanced. You can compare to the reference tables but no adjustments needed in this case if you had zone V tonic in mind.
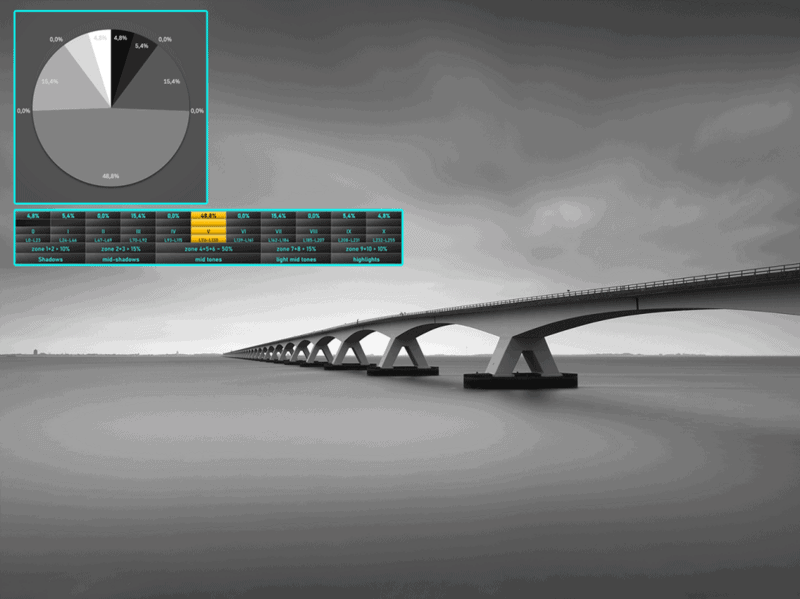
The Zeeland bridge photo, taken with an achromatic Phase One. I intended to make a classic, rich mid-gray photo of this. This feeling has now been confirmed with the analysis results. It complies with the Classic Harmonic Model with the tonic in Zone V according to the charts.
Contrast Analysis - Full Image

The contrast analysis tab indicating the contrast in zones. The Open Detailed Dialog button opens a dialog with exact contrast information for each cell.
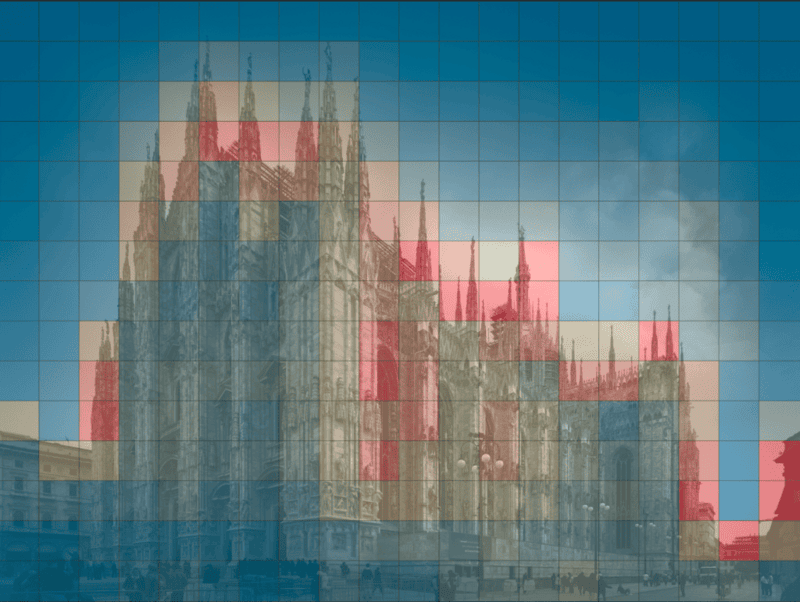
The 20×15 contrast map of the Duomo in Milan. Red indicates highest contrast, blue indicates lower contrast. Contrast analysis needs to be performed with the highest possible resolution. A JPEG file will not give you accurate information.
Contrast Analysis - Selective

The selective contrast analysis shows the contrast difference in zones per selected area.

Contrast analysis using only selected parts of the image, in this case: the building, sky and the steps to the building
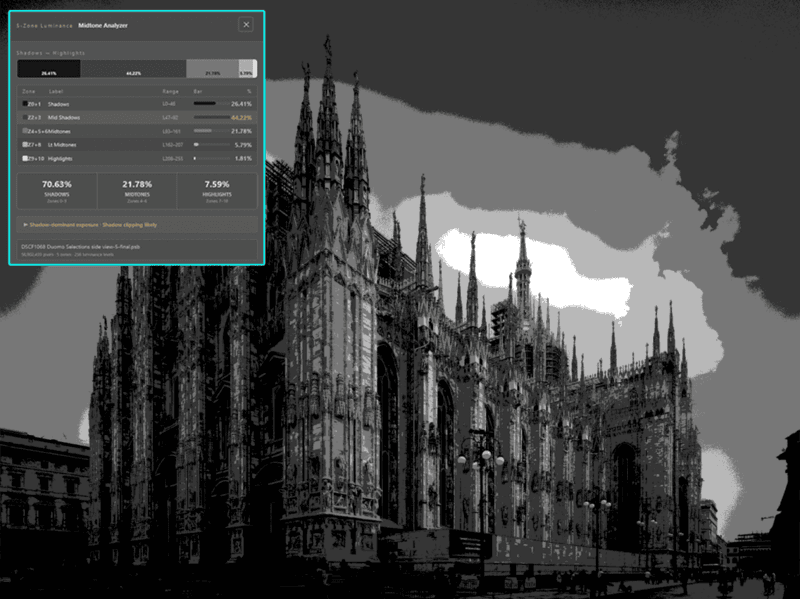
Major Tonal Areas Map
A map showing the 5 major zones in an image to assess quickly how the tonal distribution is. The Midtone analysis button shows the exact numbers for the 5 tonal regions.
Research, rationale and justification
The tonal distribution models mapped from harmonic intervals in music and from the 60-30-10 design principle from the world of design to the Classic Harmonic and Hybrid 60-30-10 model have been documented in a 110-plus-page document, including exact calculations and the rationale for each calculation.
It also includes register profiles from the world of music to demonstrate that a melancholic song for example, has a similar profile with a similar tonic and accents, as an image with that tonic and mood. That document is not available to the public as it will be part of a book that will be released, hopefully, in 2027.
But if you are one of the participants in any of my upcoming on-location architecture workshops, you will have exclusive access to it (and more theoretical and technical novelties) and can challenge my rationale and calculations.
To get an impression of the depth and detail of the rationale you will find 6 pages from the 110-page document. Click to see the image large.
System Requirements
- PS CC 2021 or higher is recommended
- Fully compatible with Adobe PS CC 2026 (v27.x.x)
- Mac(Apple Silicon and Intel) and Windows compatible, no Linux support
- The plugin runs language independently.